Forest edge effects for the three glade types in Mount Meru Game Reserve 
2. Tshwane University of Technology, Private Bag 620, Pretoria, South Africa
3. U.S. Fulbright Scholar (Independent); College of African Wildlife Management Mweka, P.O. Box 3031, Moshi, Tanzania
 Author
  Correspondence author
International Journal of Molecular Evolution and Biodiversity, 2015, Vol. 5, No. 3 doi: 10.5376/ijmeb.2015.05.0003
Received: 10 May, 2015 Accepted: 16 Jun., 2015 Published: 21 Jul., 2015
Ladislaus et al.,, 2015, Forest Edge Effects for the Three Glade Types in Mount Meru Game Reserve, International Journal of Molecular Evolution and Biodiversity, Vol.5, No.3, 1-12 (doi: 10.5376/ijmeb.2015.05.0003)
Forest edges have conservation value due to differences in plant species composition, richness and diversity based on the habitat characteristics. This study characterized and compared the forest edge effects of five man-made, five upper and 15 lower natural glades in the Mount Meru Game Reserve. The plant species composition differed significantly between the three glade types. The edge effect was observed between 12.5 - 22.5 and 42.5 - 52.5 meters from the forest edge into the forest interiors of lower and upper natural glades respectively. Eight plant species (Selaginella kraussiana, Plectranthus elegans, Cynoglossum coeruleum, Bersama abyssinica, Asplenium bugoiense, Nuxia congesta, Carrisa edulis and Clutia abyssinica) were found to be indicator species along the forest edge of upper natural glades, one species (Diospyros abyssinica) were indicator of lower natural glades and three species (Solanum incanum, Croton macrostachyus and Teclea nobilis) were indicators of man-made glades. In summary, natural glades and their edges have high plant conservation value as compared to man-made glades due to high plant species abundance, richness and diversity and this rate the conservation value of man-made glades to be low. Therefore, clearing of plants from the forest edges of man-made glades does not in itself contribute to plant biodiversity, although forest-edge plant composition, diversity and richness contributes to ecosystem heterogeneity which supports wildlife conservation.
1 Introduction
Forests and woodland habitats of East Africa, treeless, open grassland patches, or glades, can be found as relatively permanent landscape mosaic communities that increase ecosystem heterogeneity (Young et al., 1995). In the Laikipia ecosystem of Kenya, glades in acacia bushland and woodland communities are reportedly in old settlement sites of traditional pastoralists (Herren, 1987; Young et al., 1995). Kahana et al. (2013a; 2013b) reported differences in vegetation types in the forest, forest edge and glades of man-made, upper natural and lower natural in Mount Meru Game Reserve. Edge effects differed in depth and sharpness, with plant species richness and diversity being lowest inside glades and gradually increasing with distance from the glade interior towards forest-glade edges (Kahana et al., 2013a; 2013b). The forest or woodland edge reflects demographic influxes of individual plant species, each with a distinctive life history and physical requirements, which translate into unique edge zone distributions (Matlack and Litvaitis, 1999). Thus, in contrast to the interior, forest or woodland edges are associated with greater species richness including edge specialist species (Murcia, 1995; Matlack and Litvaitis 1999).
The spatial nature of heterogeneity differs depending on species distribution relative to glade types. This is determined by plant composition and structure that influence the distribution and diversity of birds and mammals in the glades and surrounding forest (Kahana et al., 2013a; 2013b).
In addition, plant abundance and vegetation type at the edges shows considerable variation among sites ecological succession (Matlack and Litvaitis, 1999). Forest edges are typically hotter, drier, windier, and sunnier than the forest interior because they are exposed to more sunlight and air heated in the grassland clearing (Murcia, 1995). These micro-environmental changes at the edges may have a significant impact on the resources, e.g. an increase in plant diversity at the edge will attract a high number of animals to forage there (Gutzwiller and Anderson, 1992;Murcia, 1995).
The character of the edge vegetation also strongly influences the edge zone. For example, in forests the microclimate is controlled by the crown canopy, whereas in clearings the soil is the thermodynamically active surface controlled by temperatures (Harris, 1988; Murcia, 1995; Turner, 1996; Degraaf and Miller, 1996; Zuidema et al., 1996; Baker et al., 2002). Herbaceous species also have similar light response, characterized by increased densities of light-demanding species near the edge (Gutzwiller and Anderson, 1992; Matlack, 1994; Murcia, 1995). The changes in plant composition and structure at the edges will thus influence animal and bird distributions (Harris, 1988; Terborgh, 1992; Murcia, 1995;Turner, 1996; Malcolm, 1999; Fahring 2003). Ungulates are attracted to habitats because of plant composition and structure (Matlack and Litvaitis, 1999; Fink et al., 2006).. Herbivores prefer the habitat edges because of the higher structural complexity, more varied composition and greater availability of food (Matlack and Litvaitis, 1999).
Glades provide valuable habitats for a wide range of domestic and wildlife species. Glades located in the forest matrix differ in plant communities and hence, influence the pattern of resource use by animal species using the glades, the surrounding forests or both (Kahana et al., 2013a). Glades edges provide an abundant amount and wide variety of shrubs and trees for browsers, shelter for ungulates against predators, and ungulates may use the glades for locating water and mates (Pratt and Gwynne, 1977; Shaw, 1985).
At the Mount Meru Game Reserve, there are three glade types of different sizes found in dissimilar, although adjacent habitats. this provides an ideal area to study the plant species composition, distribution, abundance and diversity in glades of different sizes and in different glade types. The objectives of the study were to 1) characterize the glades (in regard to glade size, altitude, and nearest neighbor); 2) determine forest-edge plant composition, abundance, structure, richness and diversity at the forest-edge; and, 3) determine the biodiversity and conservation value of the plants at the forest-edge for each glade type. The overall goal of the study was to compare forest edge effects for the three glade types and provide a recommendation as whether man-made glades should be actively managed (status quo) to conserve plant species or if they should be allowed to revert back to forest.
2 Materials and Methods
Study Site
The study was conducted at Mount Meru Game Reserve, Tanzania, located at 030 16’ to 030 20’ S; 360 45’ to 360 53’ E on the eastern slopes of Mount Meru. The reserve is 66 km2 in size and is mountainous with elevations ranging from 1 400 to 4 566 meters above sea level (m.a.s.l.). The habitats of the reserve include evergreen forest, secondary forest, shrub land, wetlands and glades (Mangubuli and Lyamuya, 1988).
Mount Meru Game Reserve has a total of 33 glades: 6 man-made, 21 lower natural and 6 upper natural. Lower natural glades were formed as a result of movement of masses of water, mud, rocks, and lava that cascaded down the eastern side of the Mount Meru and support grass growth (Guest and Leedal, 1953). The soil of upper natural glades is shallow with a rocky surface substratum that supports grass growth. Man-made glades were created in the year 1986 by clearing the forest edge trees and shrubs. The clearance was done by expanding small portions of open grassland in the forest into large open grassland habitat for easy observation of forest animals during game viewing and hunting. Currently are managed for biodiversity conservation, ecotourism (game and bird viewing, walking safaris and campsites), field laboratory training for students, and research in the field of wildlife management and conservation.
Rivers Jamari and Baribari flow through the reserve near all of the glades. The Reserve has two rainy seasons: a short season between October and December, and a long rainy season between March and June. Annual rainfall ranges between 1 300 to 2 400 mm. The annual mean maximum temperature is 25.4 0C and the annual mean minimum temperature is 12.80C. Lower natural glades are maintained by flooding during the rainy seasons, and natural glades are maintained by grazing animals; while man-made glades are maintained by grazing animals, as well as periodic slashing to remove the encroaching trees and shrubs. Common mammals found in the MountMeru Game Reserve, include: Common warthog (Phacochoerus aethiopicus), African elephants (Loxondota africana), African buffalo (Syncerus caffer), Common duiker (Sylvicapra grimmia), Leopard (Pathera pardus), Giraffe (Giraffa camelopardalis), Bushbuck (Tragelaphus scriptus), Waterbuck(Kobus ellipsiprymnus), Mountain reedbuck (Redunca fulvorufula), Olive baboons (Papio anubis), Vervetmonkeys (cercopithecus aethiops), Blue monkeys (Cercopithecus mitis), and Black-and-white colobus monkeys (Colubus guereza) (Assad, 1987).
Data Collection
The research design followed a three-way comparison of glade characteristics, and vegetation structure of the forest-glade edge for the three glade types. A total of 25 glades were randomly selected: five man-made, fifteen lower natural and five upper natural. Vegetation surveys were conducted by randomly setting up seven plots (10 m x 5 m = 50 m2): starting at 2.5, 12.5, 22.5, 32.5, 42.5, 52.5 and 62.5 m from the forest-glade edge into the forest. Vegetation structure within each plot was classified in terms of growth forms according to (Edwards, 1983) and plants were identified to the species level (Okwaro, 1994). Plant total abundance, percent basal cover, species richness, and species diversity were determined for each plot, as well as percent canopy cover and tree diameter at breast height (DBH).
Data Analysis
Glade size, glade altitude and distance to nearest neighbor were compared for the three glade types using Kruskal-Wallis ANOVA. Plant total abundance, percent basal cover, species richness and species diversity and percent canopy cover for the seven forest plots, were compared within and between the three glades types using one-way ANOVA to test the effect of glade type on vegetation structure. Shannon-Wiener (SW) diversity index (H’) was used to calculate plant species diversity (Zar, 1984). Forest plant total density (stem/hectare), species richness and heterogeneity for the three glade were calculated. Species richness, total abundance, basal cover, and proportional plant cover for each of the five growth forms (grass, forbs, dwarf shrub, shrubs and trees), were compared between the three glade types using one-way ANOVAs. Post-hoc comparisons (Least Significance Difference (LSD) were performed to determine how deep the edge effects penetrated into the forests bordering the three glade types. Chi-square analyses were used to determine if different plant growth forms were associated with forest edge or interior habitats.
Multiple Response Permutation Procedure (MRPP) was used to test for group differences in plant species composition between man-made, lower natural and upper natural glades, as well as within group homogeneity (Mccune and Mefford, 1999). Indicator species analysis was used to detect and describe the value of plant species as a habitat indicator in the forest edge or forest interior. Indicator species are species that are abundant and frequently sighted in a given habitat (Mccune and Mefford, 1999). This analysis combines information on relative abundance and frequency of each species in a particular habitat to produce and indicator value that ranged from zero to 100 with 100 being a perfect indication).
3 Results
Glade size, altitude and nearest neighbour distance (NND)
Data for glade size, altitude and distance to nearest neighbour for all three glade types are listed in Table 1. As shown in Table 2, glade size and nearest neighbour distance did not differed significantly between the three glade types. However, the altitude of the three glades types did differ significantly with upper natural glades being the highest above sea level.
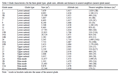 Table 1 Glade characteristics for the three glade types: glade sizes, altitudes and distances to nearest neighbors (nearest glade name) |
|
Table 2 Differences between glade size, altitude and nearest neighbor distance between three glade types |
Forest-Edge and interior vegetation
A total of 162 plant species were recorded in the forest of the three glade types (Table 3). Of these, 88 were found in more than one glade type, as follows: 43 in all three glade types, 26 in lower natural and man-made glades, 19 in lower and upper natural glades, and five in the man-made and upper natural glades. Seventy plant species were found only in a single glade type, with 35, 19 and 16 in lower natural, man-made and upper natural, respectively (Table 3).
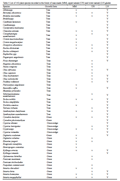 Table 3 List of 162 plant species recorded in the forest of man-made (MM), upper natural (UN) and lower natural (LN) glades |
The different forest plant growth forms of different trees, shrubs, dwarf shrubs, forbs, and grasses recorded were not associated with edge or interior forest habitat for upper natural glades (χ2 = 9.52, df = 8, p = 0.30) and man-made glades (χ2 = 13.89, df = 8, p = 0.09). However, plant growth forms of species recorded were associated with forest edge or interior habitat for lower natural glades (χ2 = 15.58, df = 8, p < 0.05).
Forest plant total density (stems /hectare) was highest in upper natural glades (36 800), high in lower natural (22 700) and lowest in man-made glades. Species richness and diversity was highest in lower natural (n=128 and H’ 2.98 respectively), high in man-made (n=97 and H’ 2.68 respectively), and lowest in upper natural glades (n=86 and H’ 2.44 respectively). Upper natural was the most heterogeneity (0.52, followed by man-made (0.42) and least in lower natural (0.30).
The plant species composition in the forest of man-made, upper and lower natural glades differed significantly between habitats, i.e. the habitat occupy different region of species in space (MRPP; T=-6.13, A=0.20, p<0.001). Forest edge in this study refers to the interface between forest and glades, whereas forest interior refers to a forest that show no detectable edge influence and edge/interior refer the interface between edge and interior forest habitat (Harper et al., 2005). Indicator plants are plants that indicate habitat condition.
Edge effects and distance into the forest
In both upper and lower natural glades, percentage plant basal cover changed significantly with distance into the forest (F(6,28) = 2.80, p< 0.05) and ( F(6,98) = 2.36, p < 0.05 respectively) Post-hoc comparison (LSD, p<0.01) indicated that in upper natural glades, this edge effect was prevalent between 42.5 m and 52.5 m and Lower natural glades, this distance was 12.5 and 22.5 m (Figure 1). No edge effect was noted in the man-made glades. In upper natural glades, the total abundance of shrubs (R=-0.03, p>0.05, n=11) and dwarf shrubs (R=-0.01, p>0.05, n=3), and basal cover of dwarf-shrubs (R=-0.01, p>0.05, n=3), decreased with distance into the forest. In upper natural glades, shrub species richness differed significantly with distance into the forest F(6,28)=2.12, p<0.05. and lower natural glades, dwarf shrub total abundance and percentage basal cover differed significantly with distance into the forest F(6,98) =2.44, p<0.05 and F(6,98) = 2.50, p<0.05 respectively. Similarly shrub total abundance F(6,98) = 2.12, p<0.05.
|
Figure 1 Relationship between plant basal cover and edge distance for upper and lower natural glades |
Forest edge and interior indicator plants
Twelve plant species in the three glade types were identified as indicators of forest edge and four species for the forest interior as listed in Table 4. These were four species of forbs, two species of shrubs and trees for upper natural glades. One tree species was an indicator species in lower natural glades, while two trees and one shrub species were indicator for man-made glades. In the forest interior of the upper and lower natural glades, four species were identified as indicator plants and none was found in man-made glades as there was no forest interior. In upper natural glades, the indicator plants species were a shrub, forbs and a tree, while in lower natural glades only one was identified tree species (Table 4). Bersama abyssinica and Selaginella kraussiana appeared in both forest edge and interior.
 Table 4 Indicator plants in the forest edge and forest interior of the three glade type |
Trees diameter at breast height (DBH) differed significantly between the three glade types (F(2 189) =3.06, p<0.05). Upper natural glades had the highest mean DBH with 15.5 cm, followed by 10.7 cm and 8.6 cm in lower natural and man-made glades, respectively.
4 Remarks
Upper natural glades – forest edges and interiors
The mean altitude of the upper natural glades studied was 2 059 m.a.s.l, which was 405 m and 485 m than
the mean altitudes of lower natural and man-made glades, respectively. In general, higher elevation and more mountainous topography results in higher rainfall, lower temperatures, stronger winds and more rocky, shallower soils into glades (Vesey-Fitzgerald, 1974; Pratt and Gwynne, 1977; Kashenge, 1986; Blundell, 1987; Haila, 1999). This is supported by the findings that all but one of the indicator plants grows in damp, shaded and colder habitats, as well in shallow soils (Table 4). At the forest edge of upper natural glades, two indicator tree species Nuxia congesta and Bersama abyssinica were found as reported by (Blundell, 1987) to grow on shallow, damp soils at forest edges and interiors respectively The forest of upper natural glades had the highest total stem density at an average of 36 800 stems per hectare, as compared to 2 7700 stems per hectare in the forest of lower natural glades. In addition, had the largest DBH (15.5 cm), higher than 10.7 recorded at lower natural glades and lowest in man-made (8.3 cm) . These findings suggest that the higher rainfall allowed a denser stand of plantsand larger growth in tree diameter, althoughthe upper natural glades also harboured the lowest diversity and number of unique plant species (Fahring, 2003). High altitude influences plant diversity and thus inherently limit species richness and may account for these findings (Hansen and Rotella, 1999). Surprisingly, the upper natural glades were also the forest type in which the plants were the most heterogeneous within glade type, with nine indicator plants found at the forest interior and edge, compared to two in the lower natural and three in the man-made glades. This apparent incongruity may be explained by the greater number of individual plant per species at these high altitude glades.
Along the forest edge (i.e. 2.5 m), there was on average, only a single species of shrub found, but shrub species richness increased to between four and five species with increasing distance into the forest (i.e. 12.5 m). Two indicator shrubs found at the edge were Clutia abyssinica or Carrisa edulis, and both grow in disturbed areas along the forest edges (Hansen and Rotella, 1999; Royal et al., 2010). Ungulates browsing along the forest edge exert a high browsing pressure disturbing forest edges that only these two unpalatable species can tolerate. Both C. edulis and C. abyssinica are because have sticky milky sap and C. abyssinica has spines that may deter ungulates from browsing them (Royal et al., 2010).
In the upper natural glades, edge effects were prevalent at 42.5–52.5 m into the forest. This is because the forest canopy is not high in these forests, and thus, the relatively colder wind and rain penetrate a considerable distance from the edge (i.e. horizontal distance) into the forest. The percentage basal cover and plant species richness also decreased with distance into the forest and the forest was uniform in composition and less influenced by the edge effects. The total abundance of shrubs and basal cover of dwarf shrubs probably caused the observed change at 43–53 m into the forest. Shrubs and dwarf-shrubs thrive on the changing microclimate caused by the interplay of wind, temperature and moisture (Murcia, 1995). The basal cover of forbs (59%) was higher in upper natural glades than the other glade types. The four-indicator forbs, Selaginella kraussiana, Plectranthus elegans, Cynoglossum coeruleum, Asplenium bugoiense, grow in humid, damp shaded areas and shallow soils (Blundell, 1986). S. kraussiana was the only plant found in both the forest interior and edge; this is probably due to its ability to compete for both light and shade resources (Spies and Turner, 1999).
Lower natural glades – forest edges and interiors
The lower natural glades were located at a mean altitude of 1 654 m.a.s.l., lower than upper natural glades. This glade type had the most homogenous plant species composition, and this is typical of vegetation found at lower topographies (Haila, 1999). The indicator trees in the forest edge of lower natural glades were Diospyros abyssinica and Olea welwitschii that grow in dark soil of volcanic ash and in shallow soils (Kashenge, 1986; Van Der Watt and Van Rooyen, 1995). The presence of volcanic ash and shallow soils indicate young, immature soils that lack the vertical development of soil horizons.
The forest of lower natural glades had a lower mean total stem density of 27 700 stems per hectare than upper natural glades 36 800 stems per hectare and highest number of unique species (35) compared to (16) for upper natural glades. In addition, a smaller mean tree DBH was observed in the forest edge of lower natural glades (10.7 cm) as compared to upper natural glades (15.5 cm). The difference in tree DBH can be attributed to difference in altitude, topography and soils between the two glade types (Haila, 1999). As tree diameter determines the age of individual trees (Spies and Turner, 1999). Lower natural glades probably harboured younger trees than upper natural glades based on their small DBH.
For the lower natural glades, edge effects were detectable at between 12.5 and 22.5 m into the forest. Because the intensity of the wind is lower at lower altitude, the wind probably does not penetrate as deep into the forest as compared to the upper natural glades. The total abundance and basal cover of shrubs and dwarf shrubs were again the growth forms that probably caused this change into the forest due to their characteristics of multi-stemmed and branching at or near ground level. This may also be due to a different microclimate at the edge of lower natural glades that influences plant species composition along the forest edge (Fahring, 2003; Harper et al., 2005). The result is a forest that is uniform in species composition and less affected by the edge effects.
Man-made glades – forest edges and interiors
The mean altitude of the man-made glades (mean 15 734 m.a.s.l) was lowest of the three glade types. The lower elevation and warmer temperatures was associated with the presence of two-indicator trees species, the Croton macrostanchyus that grows in damp soils in the forests edge, and Teclea nobilis that grows on the edge of lower montane forest (Blundell, 1987). In contrast to the natural glades, edge effects were not observed in the forest edge of man-made glades. This was due to management practice of clearing a total of two meters of trees and shrubs at the forest glade interface once a year. The forest edge of man-made glades has been cleared at Mount Meru Game Reserve for the past 36 years. This has caused the forest-glade edge to shift toward the forest interior. This shifting of the actual forest edge may have been mirrored by a similar change in the forest interior, with the result, that edge effect could establish and were thus not recorded. The clearing of shrubs and trees results in the development of dense vegetation as regenerating trees and shrubs fill in open space in the clearing (Harper et al., 2005). Formation of dense vegetation reduces wind energy penetration into the forest (Laurence et al., 2001; Harper et al., 2005). Hence, the edge effect of man-made glades is less than that of natural glades.
The forest around man-made glades had the lowest total stem density in the forest at an average of 11 914 stems per hectare, compared to lower natural glades. This was coupled with smallest mean tree DBH (8.6 cm). The small tree DBH at the forest edge of man-made glades is probably management-related, in that, big trees are cleared and only small trees are left behind. This is an indication of forest succession, where changes in structure and composition tend to be rapid immediately after clearing (Spies and Turner, 1999). Early succession is also, accompanied by younger individuals at the forest edge, which is an indication of a young forest succession (Van Amhild, 2005).
Conclusion
In conclusion, the plant species composition (as analysed by the MRPP) in the forest of man-made, upper and lower natural glades differed significantly between habitats, as well as the plant species composition of forest edges. Since the plant species found in the forest and at the edge of man-made glades were different from the others, the conservation value of these plants was judged to be high. However, the forest interior and edge found bordering man-made glades are in fact man-modified forest interiors, so the origin of plants found near this glade type can in effect be found all over the forest. This supposition obviously lowers the conservation value of these plants.
Overall, only the species richness of forest edge plants increased the conservation value of man-made glades, whereas the lack of edge effects, and the low total abundance and species richness of forest interior plants, and the low number of unique plants lowered the conservation value. I therefore judged the conservation value of forest plants of man-made glades to be too low to be conserved, although they have conservation value because they are a resource for wildlife (Kahana et al., 2013a; 2013b)
Author’s contribution
LWK designed and conducted the experiment, analysis and write up, GM designed the study, data analysis and write up TJS data analysis and write up. All authors read and approved the final manuscript.
Acknowledgements
We would like to thank the Rufford Foundation, U.K., the College of African Wildlife Management, Mweka, Tanzania, Tshwane University of Technology, South Africa, Tanzania National Parks, Tanzania Wildlife Research Institute, Tanzania Wildlife Protection Fund, U.S. Fulbright Scholar Program and Shikar Safari Club, U.S.A. for financial assistance and logistical support. We further express our gratitude to Billy Munisi and Joshua Mushi for their assistance in the field and herbarium.
References
Assad G.M., 1987, Environmental management programmes for Mount Meru Wildlife Project, Post Graduate Diploma Dissertation, College of African Wildlife Management Mweka, Unpublished
Baker J., French K., and Whelan R.J., 2002, The edge effect and ecotonal species; bird communities across a natural edge in Southeastern Australia, Ecology, 83(11): 3048-3059
http://dx.doi.org/10.1890/0012-9658(2002)083[3048:TEEAES]2.0.CO;2
Blundell M., 1987, Wild flower of East Africa, Publisher Harper Collins, Hong Kong
Degraaf R.M., and Miller R., I996, The conservation of faunal diversity in the forested landscapes Chapman & Hall, London
Edwards D., 1983, A broad-scale structural classification of vegetation for practical purposes, Bothalia, 14: 705-712
http://dx.doi.org/10.4102/abc.v14i3/4.1231
Fahring L., 2003, Effects of habitat fragmentation on biodiversity of Annual Review Ecology, Evolution and Systematics: 487-515
Fink A.D., Thompson F.R., and Tudor A.A., 2006, Songbird Use of Regenerating Forest, Glade, and Edge Habitat Types, The Journal of Wildlife Management, 70: 180-188
http://dx.doi.org/10.2193/0022-541X(2006)70[180:SUORFG]2.0.CO;2
Guest N., and Leedal G.P., 1953, The volcanic activity of Mount Meru, In: Records of the Geological Survey of Tanganyika, Government Printer Dar-Es-Salaam, 40-47
Gutzwiller K.J., and Anderson S.H., 1992, Interception of moving organisms: influence of patch shape, size and orientation on community structure, Landscape Ecology, 6: 293-303
http://dx.doi.org/10.1007/BF00129707
Haila Y., 1999, Islands and fragments, In: Malcolm L.H.Jr. (ed.), Maintaining biodiversity in forest ecosystems, Cambridge University Press
http://dx.doi.org/10.1017/cbo9780511613029.009
Hansen A., and Rotella J., 1999, Abiotic factors, In: Malcolm L.H.Jr. (ed.), Maintaining biodiversity in forest ecosystems, Cambridge University Press
Harper K.A., Macdonald S.E., Burton P.J., Chen J., Brosofske D., Saunders S.C., Euskirchen E.S., Roberts D., Jaiteh M.S., and Per-Anders E., 2005, Edge influence on forest Structure and Composition in Fragmented Landscapes, Conservation, Biology, 14: 788-782
http://dx.doi.org/10.1111/j.1523-1739.2005.00045.x
Harris L.D., 1988, Edge effects and conservation of biotic diversity, Conservation Biology, 2: 330-332
http://dx.doi.org/10.1111/j.1523-1739.1988.tb00196.x
Herren U., 1987, The people of Mukogodo, Division, Laikipia District laikipia, Report 9, Institute of Geography, University of Berna, Berna, Switzerland
Kahana L.W., Malan G., and Sylvina T., 2013a, Glade use by Common Warthog, African Buffalo, Mountain Reedbuck and Bushbuck in Mount Meru Game Reserve, Tanzania, International Journal of Biodiveristy Conservation, 5(10): 678-686
Kahana L.W., Malan G., and Sylvina T., 2013b, Forest bird diversity and edge effects on three glade types at Mount Meru Game Reserve, Tanzania, International Journal of Biodiversity Conservation, 5(11): 715-728
Kashenge S.S., 1986, Management plan for catchments forest, Arusha Region, Ministry of Natural Resources and Tourism
Laurence W.F., Didhan R.K., and Power M.E., 2001, Ecological boundaries: a search for synthesis, Trends in Ecology and Evolution, 16: 70-71
http://dx.doi.org/10.1016/S0169-5347(00)02070-X
Malcolm L.H.Jr., (ed.), 1999, Maintaining biodiversity in forest ecosystems, Cambridge University Press
Mangubuli J.J., and Lyamuya V.E., 1988, A survey of habitat in Mount Meru Forest Game Reserve Tanzania, Technical report, College of African Wildlife Management Mweka, Unpublished
Matlack G.R., 1994, Vegetation dynamics of the forest edge-trends in space and successional time, Journal of Ecology, 82: 113-24
http://dx.doi.org/10.2307/2261391
Matlack G., and Litvaitis J., 1999, Forest edges, In: Malcolm L.H.Jr. (ed.), Maintaining biodiversity in forest ecosystems, Cambridge University Press
http://dx.doi.org/10.1017/cbo9780511613029.008
Mccune B.J., and Mefford M.J., 1999, PC-ORD: Multivariate analysis of ecological data, MjM Software Design, City Oregon
Murcia C., 1995, Edge effects in fragmented forests: implications for conservation, Trends in Ecology and Evolution, 10: 58-62
http://dx.doi.org/10.1016/S0169-5347(00)88977-6
Okwaro O.J., 1994, Flowering Plant Families of East Africa, An introduction to plant taxonomy, East African Educational Publishers Nairobi
Pratt D.J., and Gwynne M.D., 1977, Range Management and Ecology in East Africa, Hodder and Stoughton Education, London
Royal, Kew, Missouri BotanicaL Gardens, 2010, Plant List version 1 (Online), Available from http://www.plantlist.org (Accessed 28 July 2011)
Shaw J.H., 1985, Introduction to wildlife management, McGraw-Hill, Inc., New York
Spies T.A., and Turner G., 1999, Dynamic forest mosaic, In: Malcolm L.H.Jr. (ed.), Maintaining biodiversity in forest ecosystems, Cambridge University Press
http://dx.doi.org/10.1017/cbo9780511613029.006
Terborgh J., 1992, The maintenance of diversity in tropical forests, Biotropica, 24: 283-292 http://dx.doi.org/10.2307/2388523
Turner I.M., 1996, Species loss in fragments of tropical rain forest: A review of evidence, Journal of Applied Ecology, 33: 200-209
http://dx.doi.org/10.2307/2404743
Van Der Watt H.V.H., and Van Rooyen T.H., 1995, A glossary of soil science, 2nd edition, The Soil Science Society of South Africa
Van Amhild J.A., 2005, Human impact on flora and vegetation of Kakamenga forest, Kenya, Structure, distribution and disturbance of plant communities in an East African Rainforest, Dissertation Zur Erlangung Des Akademischen Grades Eines Doktors Der Naturwissenschaft Fachbeneich 3: mathematic/ Nature Wissen Schaftern Universitat Koblenz-Landau vorgelegt
Vesey-Fitzgerald D.F., 1974, Utilization of grazing resources by Buffalo in the Arusha National Park, Tanzania, East African Wildlife Journal, 12: 107-134 http://dx.doi.org/10.1111/j.1365-2028.1974.tb01029.x
Young T.P., Patridge N., and Macrae A., 1995, Long-term glades in acacia bushland and their edge effects in Laikipa, Kenya, Ecological Applications, 5: 97-108 http://dx.doi.org/10.2307/1942055
Zar J.H., 1984, Biostatistical Analysis, Prentice-Hall.Inc., New Jersey
Zuidema P.A., Saver J.A., and Dijkman W., 1996, Forest fragmentation and biodiversity: the case for intermediate sized conservation areas, Environmental Conservation, 23: 90-97
http://dx.doi.org/10.1017/S037689290003914X


. PDF(178KB)
. HTML
Associated material
. Readers' comments
Other articles by authors
. Ladislaus W. Kahana
. Gerard Malan
. Teresa J. Sylvina
Related articles
. Conservation value
. Edge effects
. Glade types
. Indicator species.
Tools
. Email to a friend
. Post a comment