A Novel Method for Evolution Analysis based on Image Registration 
2 School of life sciences, Sun Yat-sen University, Guangzhou, 510275,P. R. China
 Author
  Correspondence author
International Journal of Molecular Evolution and Biodiversity, 2012, Vol. 2, No. 1 doi: 10.5376/ijmeb.2012.02.0001
Received: 07 May, 2012 Accepted: 22 May, 2012 Published: 15 Jun., 2012
Yan et al., 2012, A Novel Method for Evolution Analysis based on Image Registration, Vol.2, No.1 (doi: 10.5376/ijmeb.2012.02.0001)
Image registration is an important technique in image processing, which could be used to compare the similarity between two images. Here, a novel method based on transition probability matrix of oligonucleotide is proposed to infer the evolutionary relatedness of microbial organisms via image registration. Firstly, the oligonucleotide transition probability matrixes of microbial genomes are calculated by applying 1st order Markov Chain Method. Secondly, each transition probability matrix is converted into a color image, and then combined with each other to a joint histogram. Finally, the point set distribution of joint histogram is analyzed, and divergence formula is introduced and used as the similarity metric, which can reflect the evolutionary relatedness of organisms. For the organisms that taxonomic categories covered from kingdom to species, our results suggest that this new method is more accurate and discriminable than the methods based on single gene or oligonucleotide frequency especially for the classification under species. This method must be broadened and developed so that it can be applied to species identification and phylogeny inferring.
The traditional method of phylogenetic inference is based on multiple sequence alignment of the homologous genes for organisms (Wu and Eisen, 2008). Although this method has been applied widely for phylogenetic studies, it has its limitations. Inferring the phylogenetic relationship from any single gene or several genes not only carries some risks, but also would greatly depend greatly on whether the selected genes can truly reflect the whole evolutionary history of organisms. Furthermore, the traditional method does not have high distinguish ability, especially for taxa which is lower than the rank of Species. For instance, 16S rRNA gene which is most typically used for classification of bacteria, the phylogenic tree based on 16S rRNA cannot estimate the evolution distance between organisms of intraspecies even though their clustering is correct (Takahashi et al., 2009). Another way is compare the differences of GC content or the oligonucleotide relative abundance of complete genomes (Bohlin et al., 2008a; 2008b). But this method is not comprehensive because only the content or relative abundance of the whole genome were taken into account, ignoring the influence of adjacent oligonucleotide. Hence, Xiong et al (2008) proposed an alternative method to reconstruct phylogenetic trees based on information from oligonucleotide frequency differences across genomes. But their results indicated that the method may be effective for the classification level which is lower than Family (Xiong et al., 2008).
In this paper, we introduced a novel method based on image registration to analyze evolutionary relatedness of microbial organisms. In order to consider the influence of adjacent oligonucleotide thoroughly, Markov Chain Method was used for genomic analysis. We hypothesized that the elongation of genomic sequence was a discrete stochastic process with Markov characteristic. In this process, each oligonucleotide could transfer to next adjacent oligonucleotide by adopting any one of combination modes and would be independent of the former transition. The probability of transition among different combination modes was defined as transition probability (Phillips et al., 1987). By applying 1st Markov Chain Method, we obtained the oligonucleotide transition probability matrix of each organism, which contain whole genome’s information and can be used for the inference of evolutionary relationship, then took advantage of image registration to evaluate the diversity between transition probability matrixes by mapping their joint histogram. Here, the joint histogram divergence was used as a parameter to measure the evolutionary distance of organisms(Pass and Zabih, 1999; Mei et al., 2007). Our results illustrated that this new method could cover the shortages of the above-mentioned traditional methods and take more accurate phylogenetic analysis, which is not only for the closely related organisms, but also for the distantly related organisms.
1 Results and Analysis
1.1 The joint histogram divergence can truly reflect the evolutionary relationship of organisms
For the 100 bacterial genomes (Supplement 1), the joint histogram divergence (JHD) of any two genomes was calculated. And the results suggested that the higher rank of taxon was the larger joint histogram divergence it has. Take Streptococcus pneumoniae TIGR4 (abbreviated as S. pneu_TI) for example, the JHD of S. pneu_TI and Streptococcus pneumonia D39 that belonged to the same species was 49.0273, while that of S. pneu_TI and Streptococcus gordonii str. Challis substr. CH1, which belonged to the same genus, was 375.7789. Meanwhile, the JHD between S. pneu_TI and Lactococcus lactis subsp. Cremoris MG1363 belonged to the same family, S. pneu_TI and Lactococcus salivarius UCC118 belonged to the same order, S. pneu_TI and Staphylococcus epidermidis ATCC RP62A belonged to the same class, S. pneu_TI and Clostridium botulinum F str. Langeland belonged to the same phylum and, S. pneu TI and Aster yellows withches’-broom phytoplasma AYWB belonged to the same kingdom were 1488.7139, 2015.58, 2339.584, 3054.2965 and 4088.1014, respectively, and JHD exhibited monotonically raising trend with increasing of the phylogenetic distance. In order to investigate the general trend of JHD with the rank of taxon, all the JHD data were divided into 7 groups according to taxonomic level, such as "different strains within the same species”, "different species within the same genus”, "different genus within the same family”, "different families within the same order”, "different orders within the same class”, "different classes within the same phylum” and “different phylum within the same kingdom”. The calculated result demonstrated that the relation between the JHD’s average values of each group and its corresponding taxonomic level is positive correlation, and the Pearson correlation coefficient is 0.987 (p<0.01). Also via T-test, the difference of JHD between any two of these groups was significantly different (Figure 1). Our result suggested that the JHD was a reliable parameter for identification of evolutionary relationship because it could truly reflect the evolutionary distance of organisms.
|
|
.png)
1.2 The novel method based on image registration has higher discrimination
Because the lineage of Lactococcus lactis and other organisms is clearer, the discrimination of this novel method was evaluated on the basis of Lactococcus lactis. For example, Lactococcus lactis subsp. cremoris MG1363, Lactococcus lactis subsp. cremoris SK11 and Lactococcus lactis subsp. lactis I11403 (abbreviated as L. lac_MG, L. lac_SK and L. lac_I1, respectively) belonged to the same species Lactococcus lactis, former two belonged to the same subspecies. On one hand, the Euclidean distances of these three strains were calculated by formula (3). The results revealed that the Euclidean distance between L. lac_MG and L. lac_SK was 0.0438, while that of L. lac_MG and L. lac_I1, which belongs to the different subspecies, was 0.0624 (Table 1). The difference between taxa of “the same subspecies” and taxa of “the different subspecies” was just 0.0186. On the other hand, the difference of JHD between taxa of “the same subspecies” and taxa of “the different subspecies” was 51.6914 calculated by formula (2) (Table 2). It suggested that the JHD had a higher discrimination for the closely related organisms than the Euclidean distance did.
|
|
|
|
In addition, comparing L. lac_MG with Pediococcus pentosaceus ATCC 25745 (abbreviated as P. pen_AT) in the same order, with Staphylococcus aureus subsp. aureus USA300_FPR3757 (abbreviated as S. aur_US) in the same class and with Alkaliphilus metalliredigens QYMF (abbreviated as A. met_QY) in the same phylum, the Euclidean distances were 0.3209, 0.3918 and 0.3823, respectively, and the mean, standard deviation and coefficient of variation for the Euclidean distances of this group were 0.3650, 0.0385 and 0.1054, respectively.
It indicated that Euclidean distance couldn’t reflect the evolutionary relationship for taxon above order because the difference within class was greater than across classes. However, the JHD of L. lac_MG and P. pen_AT, L. lac_MG and S. aur_US, L. lac_MG and A. met_Qy were 1090.6251, 1291.8410 and 2305.8140, respectively, and the mean, standard deviation and coefficient of variation for JHD of this group were 1562.7600, 651.3209 and 0.4168. The difference between them increased with the rise of their taxonomic level. Similarly results could be obtained for 6 strains of Staphylococcus aureus subsp. aureus and 6 strains of Streptococcus pyogenes (Supplement 3). So, compared with the Euclidean distance, the JHD has more effective in estimation of phylogenetic relationship.
1.3 The joint histogram divergence could be a complement for the construction of phylogeny tree
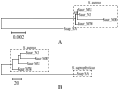
Take the 5 different strains of Staphylococcus for example, in which former 4 strains belonged to Staphylococcus aureus and the last one belonged to Staphylococcus saprophyticus. The phylogenetic tree based on 16S rRNA gene sequence revealed that the 4 strains of Staphylococcus aureus could cluster together, but their evolutionary relationship was not clear (Figure 2a). It indicated that the evolutionary relationship of organisms could not be determined just based on sequences alignment of single gene. When we then reconstructed phylogenetic tree based on joint histogram divergence matrix, the 4 strains belonged to the same species could not only cluster together but also be classified clearly (Figure 2b). The similar conclusion could be obtained for the 6 strains of Streptococcus pyogenes by the same way (Supplement 4). This exciting result showed the JHD might be a helpful complement while the single gene cannot determine the evolutionary relationship clearly.
|
|
2 Discussions
The novel method that was applied to deduce the evolutionary relationship by oligonucleotide transition probability matrix could take account of the information of whole genome and should reflect the evolutionary history of organisms more truly in theory. Here, the diversity between any two of microbial organisms was compared by image registration technology, measured quantitatively by its JHD. As we know that JHD is based on the statistics for grayscale each pixel of two color matrixes, it has an amplification effect on the diversity of genomes comparing with other methods previous mentioned. So, this new method we proposed performed higher accurately and efficiently in estimating the evolutionary distance of organisms for both closely related and distantly related as our calculated results exhibited.
Moreover, another important conclusion that we confirmed is the positive correlation between JHD and their corresponding evolution distances exists for most organisms, the closer relationship of organisms has, and the smaller JHD is. However, there are exceptions that JHD of close related organisms is larger than the one of distant related organisms. Sometimes, which may partly due to the universal occurrence of horizontal gene transfer that caused high similarity of genomic fragment of distant related organisms (Gogarten and Townsend, 2005). Another reason is probably the appearance of convergent evolution, which could lead to the genome of distant related organisms change analogously (Amoutzias et al., 2004).
Comparing with single-gene-based tree, this tree based on image registration of oligonucleotide transition probability matrices of microbial genomes had clearer branched structure for taxa both above and under the family level. Although this new method might not be succeed to analyze the phylogenetic relationship for some organisms and still be far away from perfect, there is an extensive development prospect to become a useful assistant tool or enlightening mean in identification of unknown organisms or phylogenetic inference (Tyagi et al., 2010). It could determine the lineage of unknown organisms by comparing with the definite organisms using the image registration technology. Also, it might be applicable on the genomes that have not been annotated because there will be no need to obtain homologous gene sequences and their multiple alignments. Of course, this novel method for evolution analysis we introduced needs further improvement and development to become a really effective method for species identification in the future.
3 Materials and Methods
3.1 Genomic sequences
We selected 100 bacterial genomes for this analysis. Sequences data were obtained from NCBI website (http://www.ncbi.nlm.nih.gov/genomes/). A list of full binominal nomenclature with strain tags of these organisms together with their NCBI accession numbers and lineage codes is given in Supplement 1. The "lineage code" given in the fourth column is explained below.
As the taxons in NCBI only listed their names, we have generated an explicit numbering for all taxon ranking from phyla down to strains. For example, these 100 organisms that belong to Firmicutes, Tenericutes and Proteobacteria could be abbreviated as “F.”, "T.” and “P.”, respectively. And Firmicutes consists of two classes Bacilli and Clostridia that could be abbreviated as “F.1” and “F.2”, respectively. The rest would be deduced by analogy. For instance, “Clostridium beijerinckii NCIMB 8052”, whose lineage is Firmicutes (Phylum 1)-Clostridia (Class 2)-Clo-stridiales (Order 1)-Clostridiaceae (Family 1)-Clostridium (Genus 2)-Clostridium beijerincki (Species 2), was abbreviated as “F.2.1.1.2.2” (Sun et al., 2010; Qi et al., 2004).
In addition, the 16S rRNA gene sequences of 11 bacteria used for evaluating our new method were also obtained from NCBI (http://www.ncbi.nlm.nih.gov/sites/gene/). A list of organism name, Gene ID, Taxa ID and lineage code is given in Supplement 2.
3.2 Calculating the oligonucleotide transition probability matrixes by Markov Chain Method
Oligonucleotide frequencies of genome sequence were obtained with n or 2n bp sliding windows, overlapped by 1 bp each time. And the oligonucleotide transition probability matrix was calculated by formula (1). We know protein can be coded by both sense strand and antisense strand of bacterial genome, so the oligonucleotide transition probability of two chains were computed and added together in order to gain the overall information of genome. Ultimately, a transition probability matrix with a dimension of 4n×4n would be obtained for each organism.
The formula used for oligonucleotide transition probability matrix of genomes is
p(Wn+1...W2n|W1...Wn)=f(W1...WnWn+1...W2n)/f(W1...Wn) (1)
Where f(W1...WnWn+1...W2n) represents the frequency of 2n-word oligonucleotide; f(w1…wn) represents the frequency of n–word oligonucleotide, and p(Wn+1...W2n|W1...Wn) represents the probability of W1...Wn transferred to Wn+1...W2n.
According to the rule of hereditary information transmission, the transcription and translation of genome all involve codons pairing, and each codon consists of three bases, representing one kind of amino acid or stop codon. In order to combine the computed results and the hereditary information transmission, 3 bp sliding windows were used and a transition probability matrix of a dimension of 64×64 was obtained.
3.3 Comparing the diversity between trinucleotide transition probability matrixes by image registration
Image registration based on gray scale was used to compare the diversity between trinucleotide transition probability matrixes of two genomes. First of all, transition probability matrix was changed into color matrix, in which each element corresponds to a small rectangular area. The values of the elements are indices into the current colormap that determines the color of each patch (Figure 3). Then the diversity between color matrixes was analyzed by joint histogram, utilizing both coloring information and position information. Actually, the algorithm of joint histogram is gathering statistics of the frequencies of different gray scale pairs. Firstly, a matrix of a dimension of M×N was defined, which could be expressed as HIST[M, N], where M and N represented the gray scale of the image A and image B respectively. Secondly, i was defined as pixel, so A(i) and B(i) represent the gray scale of the i-th pixel of the image A and image B, respectively. Finally, HIST[A(i), B(i)]+1 was defined for each pixel i∈A∩B. The last HIST[M, N] which matrix consists of the data of joint histogram between image A and B will be obtained and the profile of joint histogram could be plotted by software (Mei et al., 2007). Therefore, if the image A is more similar with B, the map of the joint histogram of these two images approaches more closely to a straight line of 45 degree. On the contrary, it will be more divergent (Figure 4).
|
|

|
|
.png)
Consequently, the divergent degree of joint histogram could be served as a measurement for the diversity between two images. In other words, it can be used to estimate the diversity between two genomes. The divergent degree of joint histogram was calculated by formula (2) (Mei et al., 2007). Thus, the joint histogram divergence will increase with the difference enlarging between two genomes. The color images and the joint histograms distances were obtained by MATLAB.
The formula used for joint histogram divergence is HD={∑_(i,j) [(|j-i|)^2*HIST[i,j]])/(∑_(i,j) [HIST[i,j]]} (2)
Where i and j represent the row number and column number of matrix HIST respectively; HIST[i,j] represents the value of the i-th row, the j-th column element in matrix HIST.
3.4 Estimation of the novel evolution analysis method
The Euclidean distance is usually used to calculate the diversity between sequences based on oligonucleotide frequencies. And the joint histogram divergences of trimucleotide transition probability matrixes were compared with the Euclidean distances to evaluate the discrimination of the novel evolution analysis method.
The Euclidean distance based on oligonucleotide transition probability matrixes of two genomes was calculated as
D=√(∑_(ij=1)^N (x_ij-y_ij )^2 ) (3)
Here N represents the row number and column number of oligonucleotide transition probability matrix; xi, j and yi, j represent the element value of the i-th row and the j-th column in two transition probability matrixes respectively.
Additionally, the traditional method for phylogenic inference based on single gene or several genes has limited discrimination, and it cannot distinguish the intraspecies organisms efficiently (Bohlin et al., 2008). So the joint histogram divergence was used to reconstruct the phylogeny tree of organisms that is hard to be identified by single gene. Here, for 11 organisms, their sequence alignment of 16S rRNA gene was completed by CLUSTAL X, and the single gene-based tree was constructed by neighbor-joint method. Meanwhile, the joint histogram divergence matrixes of these genomes were created and the phylogeny tree was constructed by PHYLIP. Finally, we compared the topologies of 16S rRNA gene-based tree with those of genomes’ joint histogram distance matrix-based tree to examine their ability to reconstruct the phylogenetic relationship among these 11 microbial organisms. The result would be critical for test the validity of our new method in differentiating microbial species in closely related organisms.
Authors’ Contributions
CTY collected and analyzed the data, drafted and modified the manuscript; QSH wrote and analyzed part of data. FZ also analyzed part of data; YF directed the whole project, drafted and modified the manuscript. All authors have read and approved the final manuscript.
Acknowledgment
This work was supported by National Science Foundation of China grants 10972081 and 11072080.
References
Amoutzias G.D., Robertson D.L., Oliver S.G. and Bornberg-Bauer E., 2004, Convergent evolution of gene networks by single-gene duplications in higher eukaryotes, EMBO Reports, 5(3): 274-279
http://dx.doi.org/10.1038/sj.embor.7400096 PMid:14968135 PMCid:1299007
Bohlin J., Skjerve E., and Ussery D.W., 2008a, Reliability and applications of statistical methods based on oligonucleotide frequencies in bacterial and archaeal genomes, BMC Genomics, 9(1): 1-18
http://dx.doi.org/10.1186/1471-2164-9-104 PMid:18307761 PMCid:2289816
Bohlin J., Skjerve E., and Ussery D.W., 2008, Investigations of oligonucleotide usage variance within and between prokaryotes, PLoS Computational Biology, 4(4): 1-9
http://dx.doi.org/10.1371/journal.pcbi.1000057 PMid:18421372 PMCid:2289840
Gogarten, P.J., and Townsend J.P., 2005, Horizontal gene transfer, genome innovation and evolution, Nature Reviews Microbiology 3(9): 679-687
http://dx.doi.org/10.1038/nrmicro1204 PMid:16138096
Mei Y.S., Yang S.X., and Mo B., 2007, An automatic image registration algorithm based on a novel similarity metric, Chinese Journal of Scientific Instrument, 28(4): 336-339
Pass G., and Zabih R., 1999, Comparing images using joint histograms, Multimedia Systems, 7(3): 234-240
http://dx.doi.org/10.1007/s005300050125
Phillips G.J., Arnold J., and Ivarie R., 1987, Mono-through hexanucleotide composition of the Escherichia coli genome: a Markov chain analysis, Nucleic Acids Research, 15(6): 2611-2626
http://dx.doi.org/10.1093/nar/15.6.2611 PMid:3550699 PMCid:340672
Qi J., Luo H., and Hao B.L., 2004, CVTree: a phylogenetic tree reconstruction tool based on whole genomes, Nucleic Acids Research, 32: W45-W47
http://dx.doi.org/10.1093/nar/gkh362 PMid:15215347 PMCid:441500
Sun J.d., Zhao X., and Hao B.L., 2010, Whole-genome based Archaea phylogeny and taxonomy: a composition vector approach." Chinese Science Bulletin, 55(22): 2323-2328
http://dx.doi.org/10.1007/s11434-010-3008-8
Takahashi M., Kryukov K., and Saitou N., 2009, Estimation of bacterial species phylogeny through oligonucleotide frequency distances, Genomics, 93(6): 525-533
http://dx.doi.org/10.1016/j.ygeno.2009.01.009PMid:19442633
Tyagi A., Bag S.K., Shukla V., Roy S., and Tuli R., 2010, Oligonucleotide frequencies of barcoding loci can discriminate species across kingdoms, PloS One, 5(8): 1-9
http://dx.doi.org/10.1371/journal.pone.0012330 PMid:20808837 PMCid:2924895
Wu, M., and Eisen J.A., 2008, A simple, fast, and accurate method of phylogenomic inference, Genome Biology, 9(10): 1-11
http://dx.doi.org/10.1186/gb-2008-9-10-r151 PMid:18851752 PMCid:2760878
Xiong Y.Y., Wang J.P., Lan Y.J., Wen M., and Zhang S.H., 2008, The evolutionary information of the diversity of oligonucleotide frequency of genomes, Acta scientiarum naturalium universitatis sunyatsen, 47(2): 84-88


. PDF(280KB)
. FPDF
. HTML
. Online fPDF
Associated material
. Readers' comments
Other articles by authors
. Cuiting Yan
. Qingsheng Huang
. Fen Zhang
. Ying Fang
Related articles
. Image registration
. Oligonucleotide transition probability matrix
. Joint histogram divergence
. Phylogenetic relationship
Tools
. Email to a friend
. Post a comment